|
|
|
|
|
||||||||||||||||
|
|
||||||||||||||||||||||||||||||||||||||||
|
Term Project Part II |
|
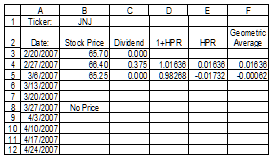
I recommend that you start on this part of the project after the first exam. While it will probably not take long to complete the project there are things that may take some time to complete. Leaving some elapse time between your efforts increases the quality of the learning experience and avoids the problems associated with the "critical need detectors," always kick in when you fail to plan and try to accomplish the task at the last minute. The critical need is detected and something fails, and prevents you from accomplishing the task. You also need time to think. In addition to meeting the general requirements for the firm you will need 10 years of historical data so make sure that the firm you choose has the necessary data. Do not assume that it is bound to be available, if the firm was not a public firm it is unlikely to be available, this is particularly true for the stock price, but is also likely to be true for other financial data. Consider that some firms will already have data for fiscal 2007 and others for fiscal 2006. It is likely that by April firms with fiscal years ending in January through early March should have reported their fiscal year results for 2007 and remaining firms should have data for fiscal 2006 available. Collection of data/information is an important part of the process and you need to allow time for its completion. Last minutes searches are frequently fruitless. By now, after at least 15 years of formal education, all of you should have developed a sound research methodology. Hint, real research does not start with the word "Google" or any other internet search engine. Why? The problem with the internet is that there is no "editor" to hold responsible for the material. Any pea brained 12 year old chimp can put up a web page, which should tell you to be extremely cautious about material you find there. Your only protection in using material from this source is in knowing what the data/information should look like, if it is reliable. You have to have an appreciation for the field by having looked at reliable information sources before you venture out in the internet mine field. You should be able to use your existing research skills to obtain the data/information. I will not tell you where or how to find the data/information, this basic research methodology is prerequisite to the course. The information is available in a variety of places and sources. It may be necessary to chain two sources together to get data for the required time period. I will give you one more hint, when you are looking for information on a college campus you go to one of the largest (usually) buildings and start there (ours has a dome in front of it). As part of the analysis process you will need to enter the data into a spreadsheet. You can use the spreadsheet to put the data into a presentation format that looks professional. You will need to graph the data using the spreadsheet graphing tool (hand drawn graphs are not acceptable, nor are handwritten papers). Finally you will need to produce a well written report that meets the requirements listed below. You will of course need to integrate the output from the spreadsheet into the report. The term project requires that you apply some of the things you will learn to a firm. As such you will need to choose a firm that meets the requirements listed and then collect, at minimum, the following information: The Data 1. The last ten years (1997 through 2006 or later) of financial information including the Balance Sheet and Income Statement. While not required you might also want to obtain the Cash Flow Statements since in some cases it is the best place to find depreciation expenses. 2. Collect the last nine years (1998 - 2006) of the end of the calendar year close common stock price, along with dividends (if any) paid during the year. This will give you eight holding period returns. 3. A brief description of the firm's business and activities, in your words. Don't just copy the company's public statements. 4. Attach the appropriate bibliographical information. The Analysis and Graphs Enter this data into a spreadsheet in a standard format. This format should not contain more than about 25 or so lines for the Balance Sheet and about 15 or so lines for the Income Statement. So you should create, simple readable, summary forms, of the financial statement, not just a dump of any data you find. You should have one sheet with 10 years of Balance Sheet information and one sheet with 10 years of Income Statements. Print (landscape) one page containing the Balance Sheets and one page containing the Income Statements. (See Figure 3) 1. Then compute the ratios in Table 3.5 (page 60) for each year of data. (You will have 10 years of ratios. Print one page containing the ratios. For the first year of data please supply documentation of the calculation of the ratio by giving the data for the numerator and the denominator for each of the required ratios. 2. Graph, over time, the ratios from each of the five (I, II, III, IV, V) categories in table 3.5 (total of 5 graphs). You may scale the data or use dual axis to achieve your results. 3. Using the market data for common stock calculate the "Holding Period Return" (See pages 7 and 8 of this handout) for each of the last 8 years and the 8 year Internal Rate of Return on a hypothetical initial investment of $1000 in the stock. The Analysis Within the scope of the data you collected comment on the performance of this company. You may choose any format you find useful to accomplish this. Be sure to keep your reader in mind. Think about convincing the reader that you have a good "solution" and that reader can readily determine that from reading the report. So organize it. Grading In grading the project I will assign a score between 0 and 4. Most individuals will receive a two (2) which means that you have, in general, done the project completely and competently. If you have some problems with your solution you will receive a one (1). If you turn in an assignment that is essentially a piece of paper, but does not complete the project you will receive a zero, meaning the project does not count.
If you make an obvious effort to complete the assignment it is unlikely that you will receive a zero. A three can be earned by doing a particularly good job. This could be an innovative approach to the solution, and/or an extra effort in the quality of presentation or explanation. A four (4) is reserved for a rare event. Every once in a while someone does an extraordinary presentation. The numbers can be converted to a percentage by the scale given in the box above, on the right.
|
 |
|
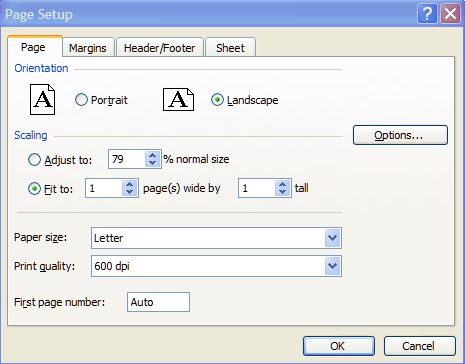
Figure 3 To print the statements use the page setup options in Excel or other spreadsheet you are using. All have similar options. In this case choose landscape, and choose to fit the output to 1 page tall and 1 page wide. Also set the margins to about .5 inch. You can find these options on the File menu, page setup. |
| [Home] [Courses] [Instructor] [Services] [What's New] [SiteMap] |
|
Please see the FeedBack page with questions or comments. |